Inspect a project
On the "My projects" page, you can find projects' cards.
Project card
A project card shows:
| Number in Figure | Card indicator name | Description |
|---|---|---|
| ① | TD index | The non-normalized amount of the TD generated by the architectural smells instances detected in the project. The higher the value, the more TD. |
| ② | TD rating | Categorizes the TD score ranges into ranked categories going from A to F, with F being the worst possible rate (high accumulation of technical debt). |
| ③ | TD score | The percentile of the TD density for a benchmark of other systems analyzed by Arcan. The higher the value, the lower the TD density and the better the system's Example: 75 TD score = system has lower TD density than 75% of the systems in the benchmark. |
| ④ | Technical debt evolution plot | The trend of Technical Debt over time (green line). |
| ⑤ | # Architectural Smells | The number of smells resulting from the latest analysis. |
| ⑥ | # LOC | The number of lines of code (LOC) resulting from the latest analysis. |
Click on "INSPECT" or on the project's name to inspect the analysis results in detail.

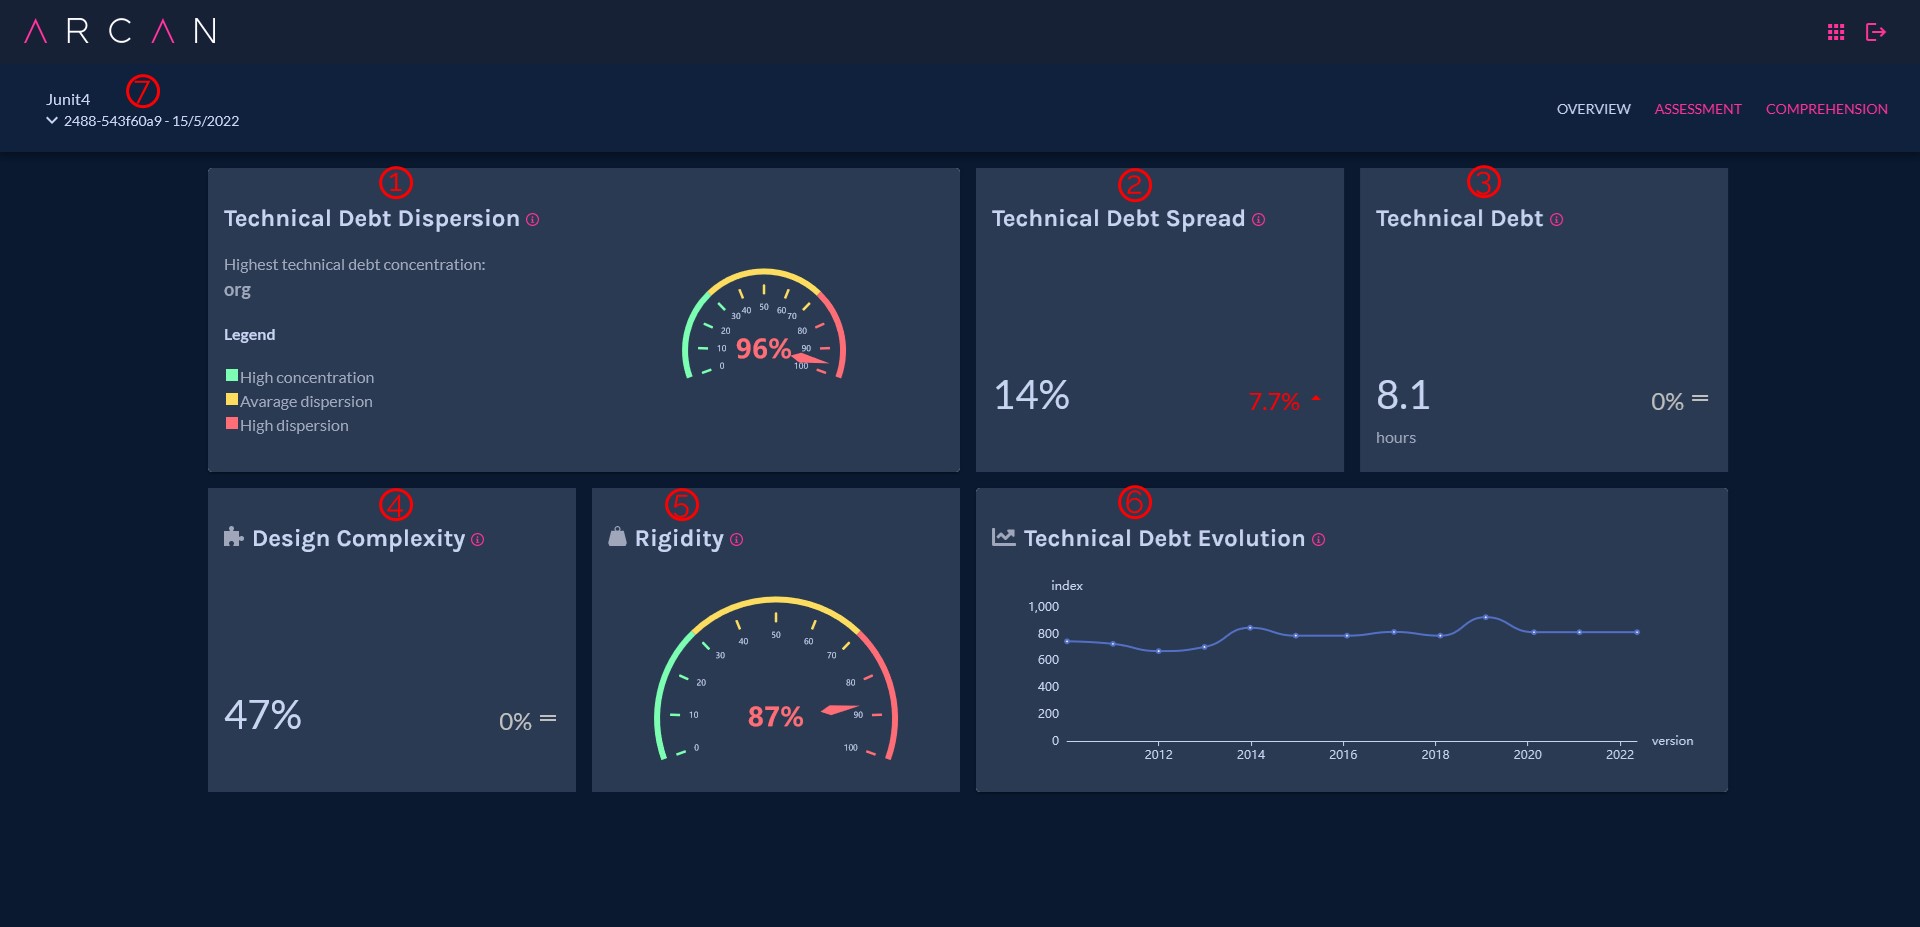
Overview page
This page offers an overview of the analysed project's overall quality and Technical Debt.
| Number in Figure | Overview indicator name | Description |
|---|---|---|
| ① | Technical Debt Dispersion | When high, it means that Technical Debt affects multiple and sparse portions of the code. When low, it means that Technical Debt is concentrated in a specific part of the code. The latest scenario is desirable because it is easier to address and solve Technical Debt when delimited. |
| ② | Technical Debt Spread | The percentage of code affected by Technical Debt. |
| ③ | Technical Debt | The number of man-hours needed to remove the detected architectural smells. |
| ④ | Design Complexity | The ratio between the number of architectural dependencies and the number of architectural components. When high, the code is tangled and very coupled, going against the modularity and separation of concerns principle. |
| ⑤ | Rigidity | Computed with the Instability Metric defined by Robert Martin. When high, the code is sensitive to change proneness (a single change causes multiple cascade changes, making maintenance difficult). |
| ⑥ | Technical Debt Evolution | The trend of Technical Debt along the code history. The plot appears if more than one project version is analysed. |
| ⑦ | List of analysed versions | The list of analysed versions. If the analysed repository is a Git repository, the list reports the version (commit) hash. |
Assessment page
The table shows the list of architectural smells and some of their characteristics.
Each row contains the data of a single instance of Architectural Smell.
Click on the name of a column to sort by it.
Table description:
| Number in Figure | Column name | Column description |
|---|---|---|
| ① | ID | The unique identifier of the Architectural Smell. |
| ② | Smell Type | The type of Architectural Smells. At the moment, Arcan detects four smells: "Cyclic Dependency", "God Component", "Hub-Like Dependency", and "Unstable Dependency". |
| ③ | Tech debt index | The amount of Technical Debt caused by the single Architectural Smell. The sum of the Technical Debt of each smell corresponds to the Technical Debt index reported in the project card. |
| ④ | Severity | The estimate of how much the Architectural Smell is critical for the project. Ranges from 1 to 10 where 10 is the worst possible case. It is based on the smell's characteristics (such as size and shape) and it is computed thanks to a proprietary machine learning model trained on manually-classified examples. |
| ⑤ | Affected type | The type of the affected component (e.g., for Java, class or package). |
| ⑥ | Affected Elements | The architectural components affected by the Architectural Smell. |
| ⑦ | Size | The number of Architectural Components affected by the Architectural Smell. |
⑧ To manipulate the table (e.g., filter results) and download the table data, use the commands on the top-right of the table. ⑨ Click the arrow on the left to expand the row. Here you can find information about the detection rule applied and the values of the parameters that triggered the smell detection.

Architectural smell graph page
Click on the pink button with the smell ID to open the graph representation of the Architectural Smell.
At the top-left of the page, you can find the controls of the graph.
- ① Reload graph layout
- ② Centre graph
- ③ Turn zoom on/off
At the top-right of the page, you can find additional controls for graph exploration.
- ④ Change the layout of the graph
- ⑤ Insert the name of a unit or container to quickly find it in the graph.
⑥ Click either an edge or a node to show the source code. The code causing the smell and that should be refactored is highlighed in red.

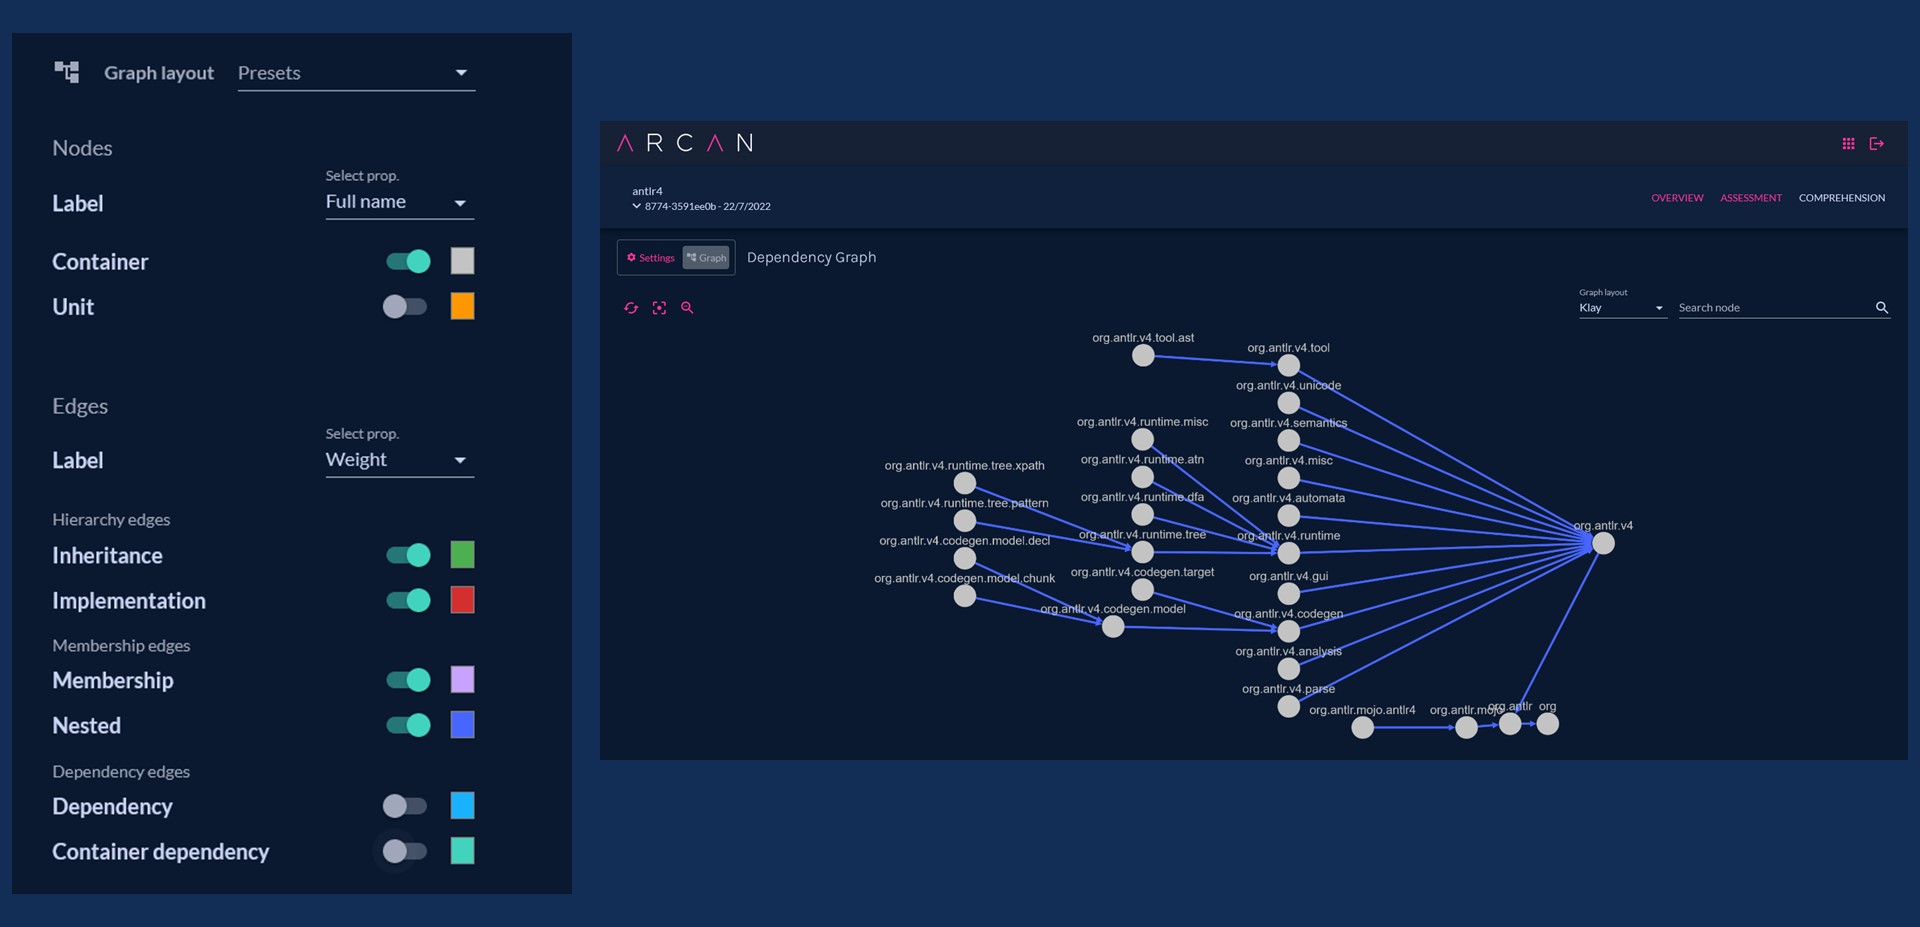
Comprehension page
Graph settings
① On this page, you can select the specific parts of code that you want to plot in the graph. (2) Use SELECT ALL and UNSELECT ALL to select or unselect all the project's components quickly.
③ You can choose the types of components and dependencies to display on the right.
Once the configuration is set up, click on the "Graph" tab to show the graph.

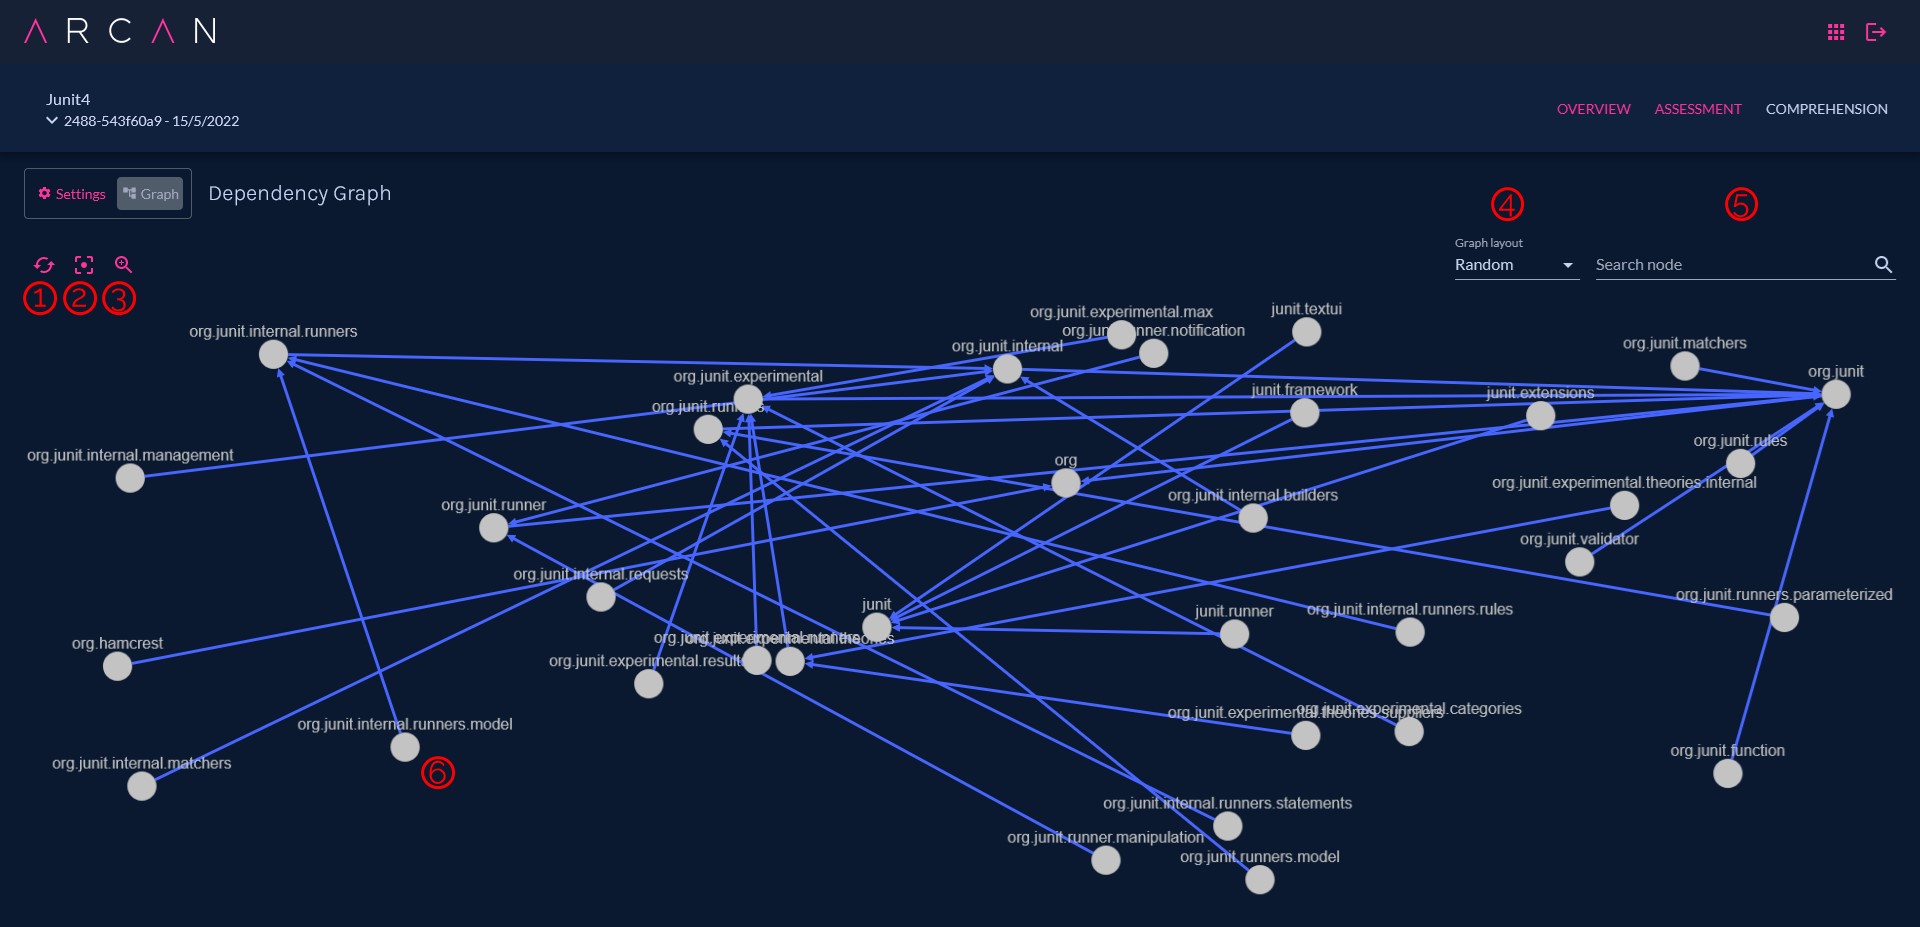
Graph
This page offers a high-level representation of the software architecture of the project under analysis. Depending on the settings you choose, you can produce different architectural views.
Use ctrl + left mouse click to select and drag portions of graph.
At the top-left of the page, you can find the controls of the graph.
- ① Reload graph layout
- ② Centre graph
- ③ Turn zoom on/off
At the top-right of the page, you can find additional controls for graph exploration.
- ④ Change the layout of the graph
- ⑤ Insert the name of a unit or container to quickly find it in the graph.
⑥ Click a node to open the "Neighbour graph", that is a portion of the graph containing only the nodes next (depht=1) to the selected node.
Neighbour graph

Architectural views
We recommend the following settings instructions to generate a set of Architectural Views.
Project tree
Useful to investigate how the project’s containers are nested one inside the other.
- Graph layout: KLAY
Project container dependencies
Useful to investigate the dependencies between different project’s containers.
- Graph layout: GRID

Project unit hierarchies
Useful to investigate how the project’s containers are nested one inside the other.
- Graph layout: KLAY

Project unit usage
Useful to identify the most used units of the project.
- Graph layout: CONCENTRIC
